When the Tide Turns Red: Do Harmful Algal Blooms Breed Crime?
We used AQUAVIEW to test whether Florida's red tide disasters drive criminal behavior. Twenty-one years of data gave us a clear answer — just not the one we expected.

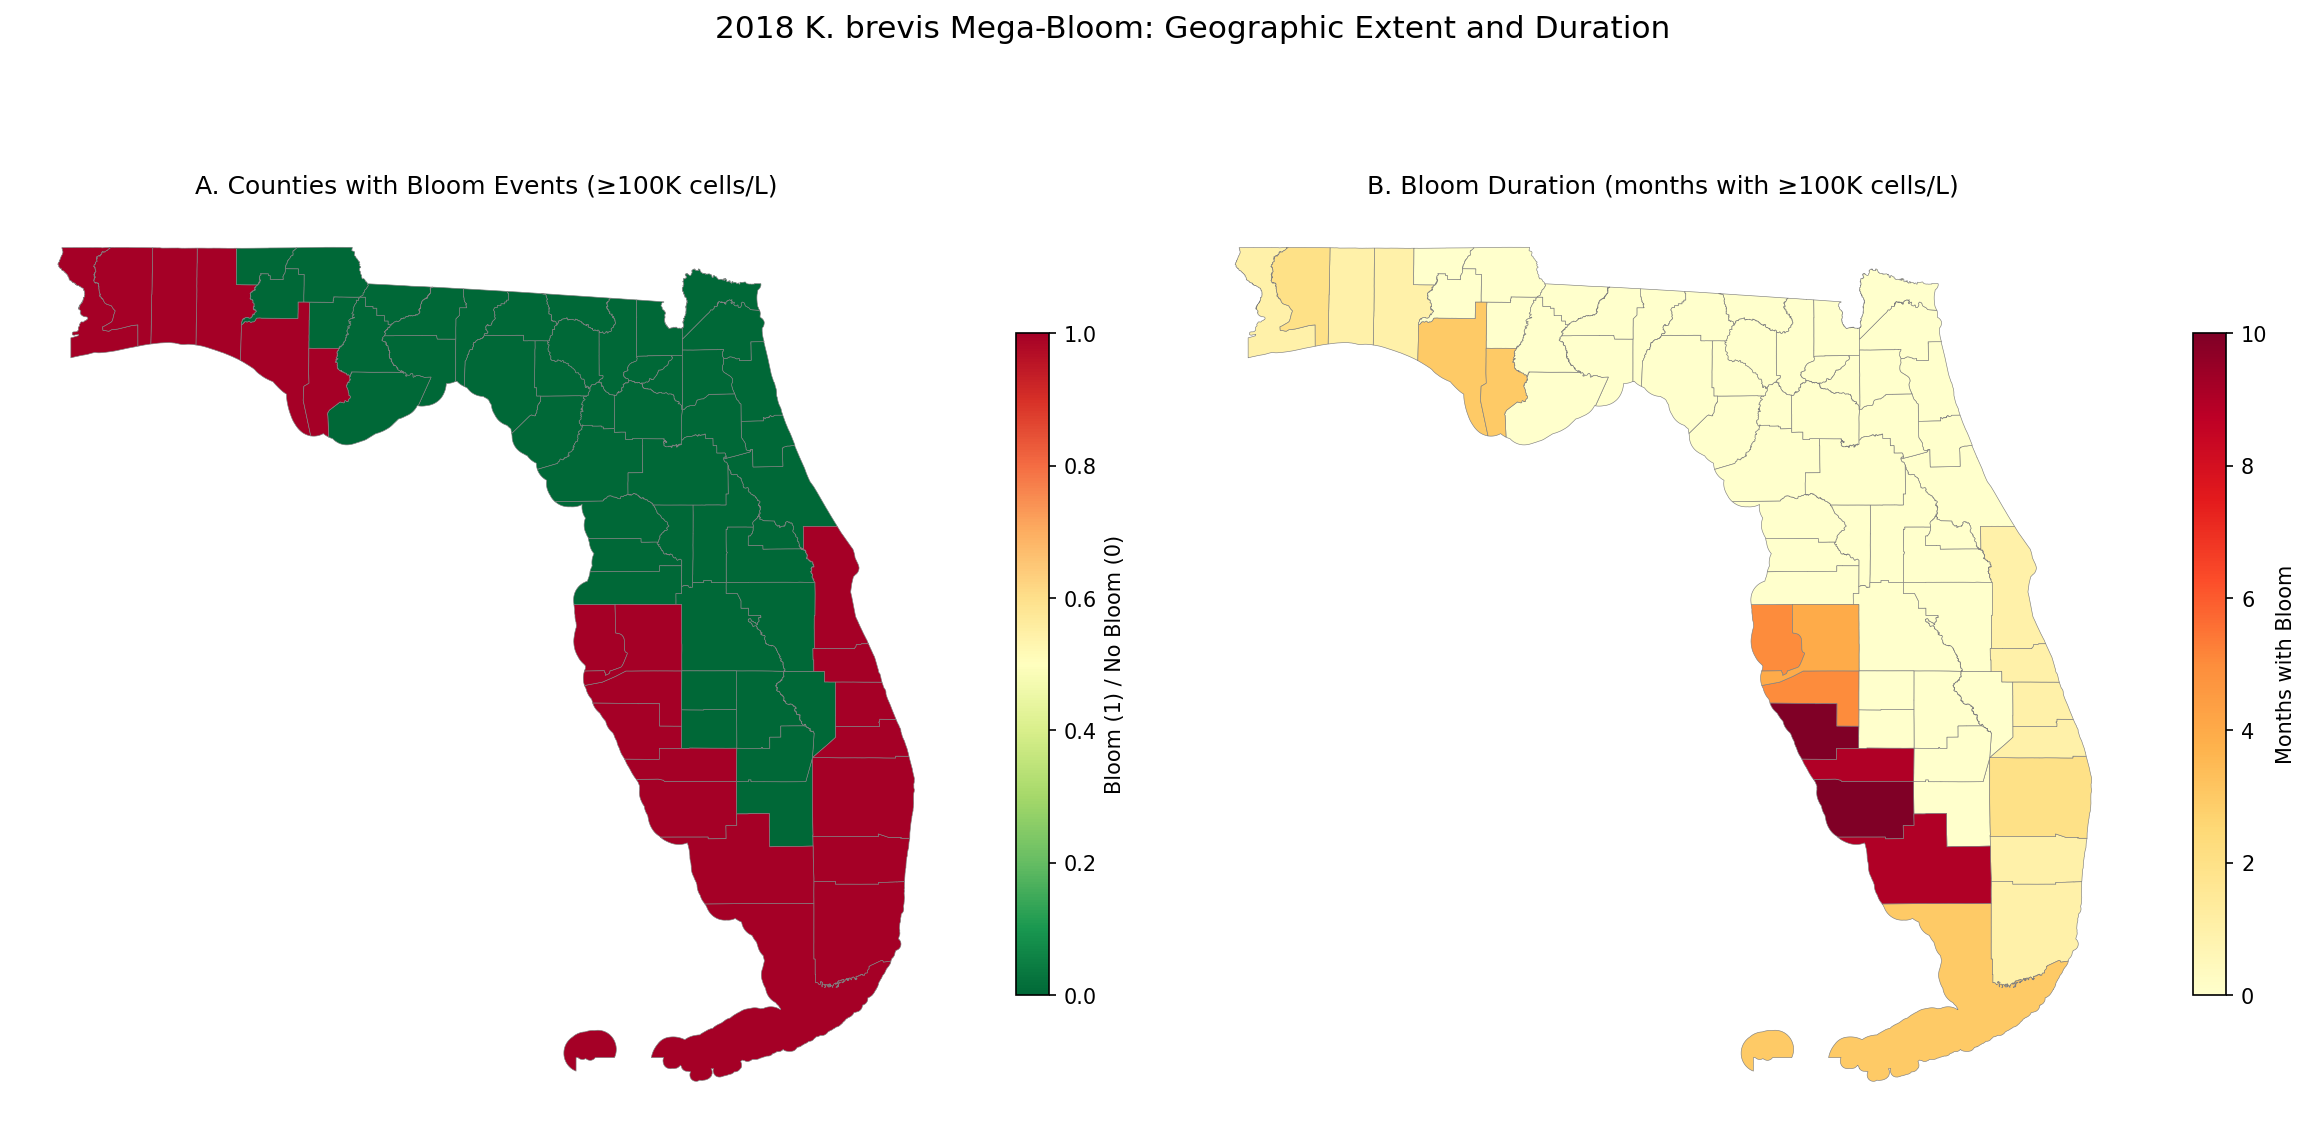
In the summer of 2018, a bloom of Karenia brevis — the dinoflagellate behind Florida red tide — exploded along the Gulf Coast to concentrations of 90 million cells per liter. That's more than 900 times the threshold for fish kills. From June through November, it choked hundreds of miles of coastline. Dead fish piled up on beaches. Manatees and sea turtles suffocated. The air burned your eyes. Beaches closed, restaurants emptied, and in Lee County alone, economic losses topped $184 million.
By the numbers, the 2018 bloom was the worst in Florida's modern monitoring history: 582 "high" cell count samples across 21 counties, far beyond anything previously recorded.
We wanted to know whether it also caused a crime wave.
The 2018 mega-bloom stretched across 21 Florida counties — the broadest geographic extent in the modern monitoring record.
Two Theories, Opposite Predictions
Criminologists have studied what happens to crime after disasters — Katrina, Harvey, Sandy, the Joplin tornado — but nobody had looked at harmful algal blooms. We thought that was worth doing, partly because HABs are so different from the sudden-onset events that dominate the literature.
There are two competing frameworks for thinking about this:
General Strain Theory predicts more crime. Environmental disasters create economic strain — lost jobs, financial insecurity — and that strain pushes people toward criminal behavior. A months-long red tide that devastates tourism and shutters fishing operations should, under this theory, produce more crime. Especially in communities that depend on the coast.
Routine Activities Theory predicts less crime. Crime needs a motivated offender, a suitable target, and no guardian, all in the same place at the same time. If red tide clears the beaches and drives away the tourists, it also removes thousands of potential victims from public spaces. Fewer people at the beach, fewer wallets to steal.
How We Did It: 209,000 Samples, 67 Counties, 21 Years
Testing this required merging large-scale environmental monitoring data with social science records at the county level, across two decades. That would have been nearly impossible not long ago.
Our environmental backbone came from NOAA's Harmful Algal BloomS Observing System (HABSOS) — over 209,000 geolocated K. brevis cell count records for Florida going back to 1953. Each record has coordinates, date, and cell concentration: the raw material for mapping bloom exposure across space and time.
On the crime side, we pulled data from the Florida Department of Law Enforcement's Uniform Crime Reports (67 counties, 21 years, seven offense categories), unemployment from BLS, and tourism employment from the Census Bureau's County Business Patterns.
What AQUAVIEW Brought to the Table
A study like this lives or dies on data integration, and that's where AQUAVIEW proved its worth. AQUAVIEW catalogs over 268,000 datasets from 37 global sources, and we used it to discover and access several datasets that went directly into the analysis:
-
CoastWatch VIIRS Satellite Chlorophyll-a (
nesdisVHNSQchlaMonthly) — Monthly 4km-resolution chlorophyll-a from the VIIRS instrument aboard Suomi-NPP, 2012–present. Elevated chlorophyll-a is a standard satellite proxy for algal bloom activity. We used it to validate and supplement the in situ HABSOS cell counts, confirming bloom timing and spatial extent from an independent source. This was particularly valuable for cross-checking the 2018 mega-bloom period. -
MUR Sea Surface Temperature (
jplMURSST41mday) — Monthly ~1km ultra-high resolution SST from the NASA JPL Multi-scale Ultra-high Resolution analysis, 2002–present. Temperature is a critical confound here: it correlates with both crime (the well-documented heat-aggression relationship) and bloom formation (K. brevis thrives in warm water). MUR SST gave us spatially precise coastal water temperatures at a resolution that land-based weather stations simply can't match for coastal counties. -
NDBC Buoy Observations — AQUAVIEW indexes 156 National Data Buoy Center stations in the Florida region, including COMPS (University of South Florida) buoys at Tarpon Springs, Shell Point, and Campbell Park — right in the heart of the 2018 bloom zone. These provided in situ water temperature, wind speed, and wave data that helped us characterize conditions during bloom events.
-
SECOORA Coastal Monitoring — The Southeast Coastal Ocean Observing Regional Association maintains 693 stations cataloged in AQUAVIEW, covering Florida's coasts with water quality and environmental monitoring data.
The result was a balanced panel of 1,407 county-year observations (67 counties × 21 years, 2000–2020) with zero missing values, covering everything from rural panhandle communities to Miami-Dade. We used two-way fixed effects models that control for everything stable about each county (geography, culture, baseline crime rates) and everything affecting all counties in a given year (recessions, policy changes, statewide trends). What's left is the within-county, within-year relationship between bloom exposure and crime.
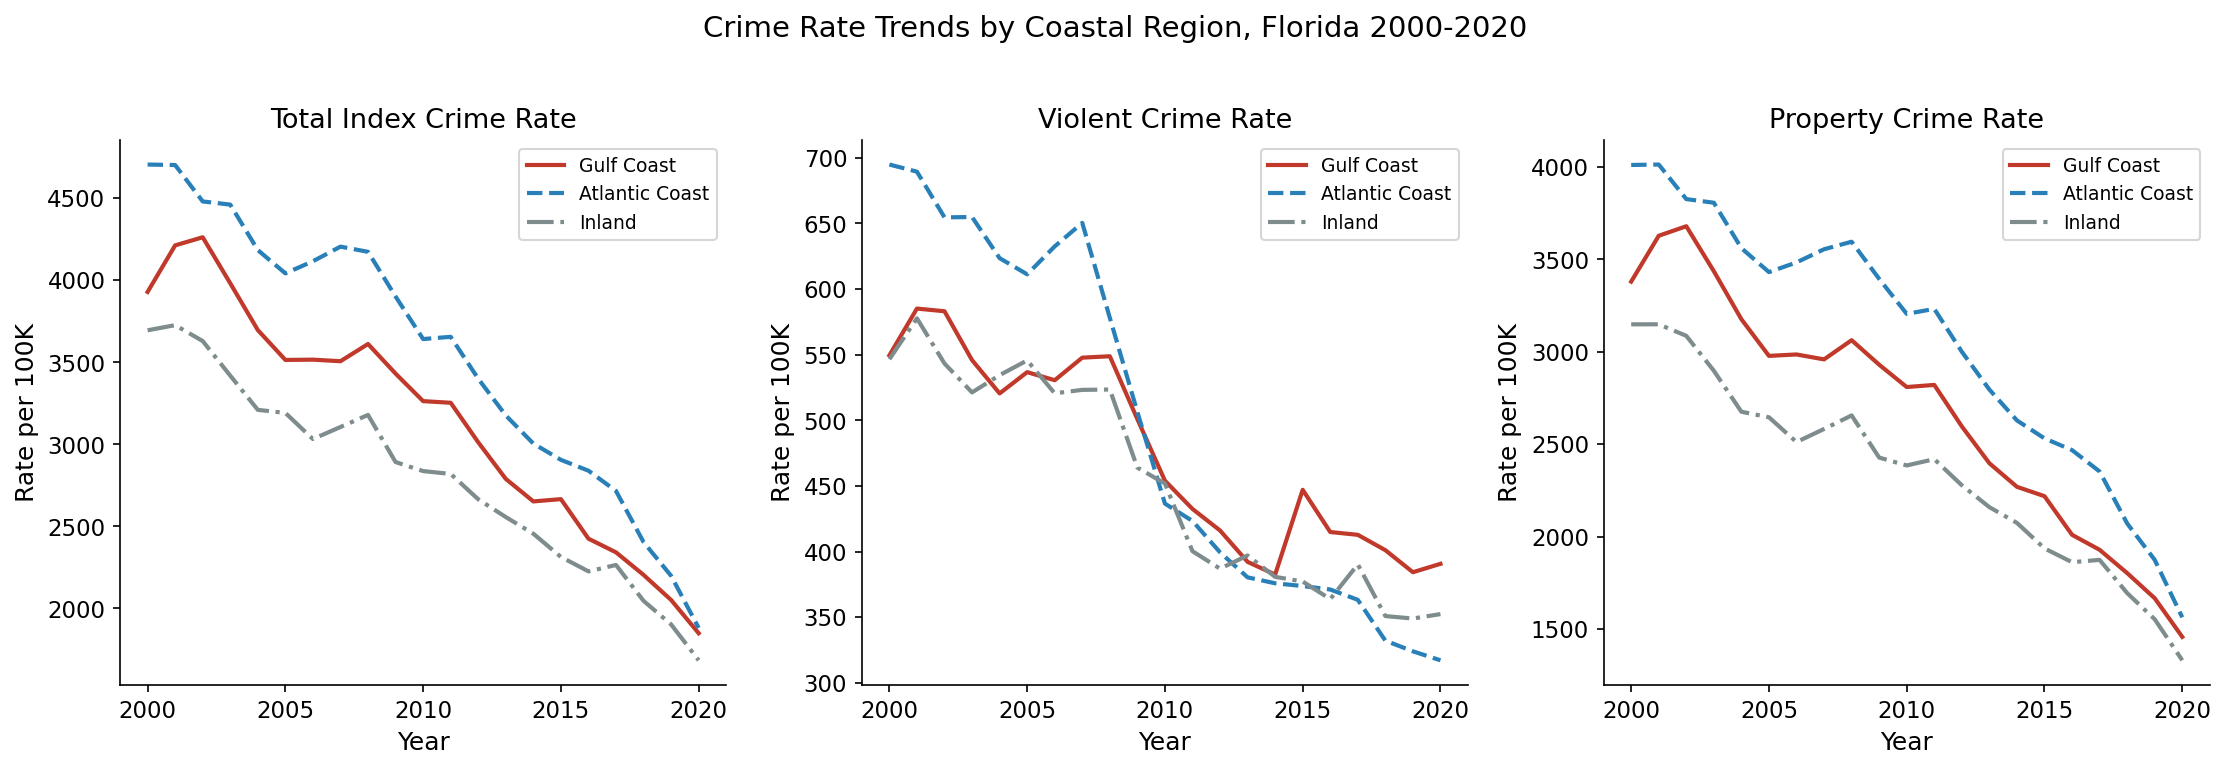 Crime rates across Florida's three regions — Gulf Coast, Atlantic Coast, and inland — over the study period.
What We Found
A Robust Null
Across the full panel, bloom events of varying intensity and duration have no statistically significant effect on any crime outcome. Not total crime, not violent crime, not property crime, not any individual offense category. The point estimate for total Index I crime was +44 offenses per 100,000 (p = 0.536) — essentially zero.
And we really tried to break this. We tested:
- Different bloom thresholds — from 10,000 cells/L (mild) to 1,000,000 cells/L (extreme). All null.
- Different bloom measures — binary indicators, continuous concentrations, bloom duration, categorical severity. All null.
- Lagged effects — does crime increase the year after a bloom? No.
- Cumulative exposure — does it take three or five years of repeated blooms? No.
- Logged crime rates — in case the functional form matters. Still null.
- Spatial spillovers — do blooms push crime to neighboring counties? No evidence of it.
- Permutation tests — we randomly reshuffled bloom events 1,000 times. Our actual estimate was unremarkable (permutation p = 0.549).
- Wild cluster bootstrap — a different inference method that guards against problems with standard errors. Same answer (p = 0.537).
- Satellite chlorophyll-a as an alternative bloom measure — VIIRS chlorophyll-a from AQUAVIEW's CoastWatch collection, used instead of in situ cell counts. The continuous satellite measure gave a near-zero estimate (β = −5.3, p = 0.926). A binary proxy (max chlorophyll >10 mg/m³) showed a marginally significant association with property crime (+274, p = 0.064), but this proxy is extremely coarse — it flags 98% of coastal county-years as "bloom" because it picks up all phytoplankton, not just K. brevis.
- MUR SST replacing land-based temperature — swapping our nClimGrid land temperature for AQUAVIEW's 1km MUR SST doesn't move the bloom coefficient much (total crime +69, p = 0.329 vs. +44, p = 0.536).
No matter how we sliced it, the null held. It's not an artifact of any particular modeling choice, data source, threshold, or inference method.
The 2018 Mega-Bloom: More Complicated Than It Looks
Given all that, what about the 2018 mega-bloom specifically? We ran a difference-in-differences analysis comparing the seven hardest-hit Southwest Gulf counties (Lee, Collier, Charlotte, Sarasota, Manatee, Pinellas, Hillsborough) to inland counties before and after 2018.
The raw result was surprising: a significant decrease of 597 total crimes per 100,000 in bloom-affected counties after 2018, driven mainly by property crime and especially larceny. That looked, at first, like evidence for Routine Activities Theory — the bloom cleared the beaches, and the crime went with them.
Then we looked at the event study, and the story fell apart.
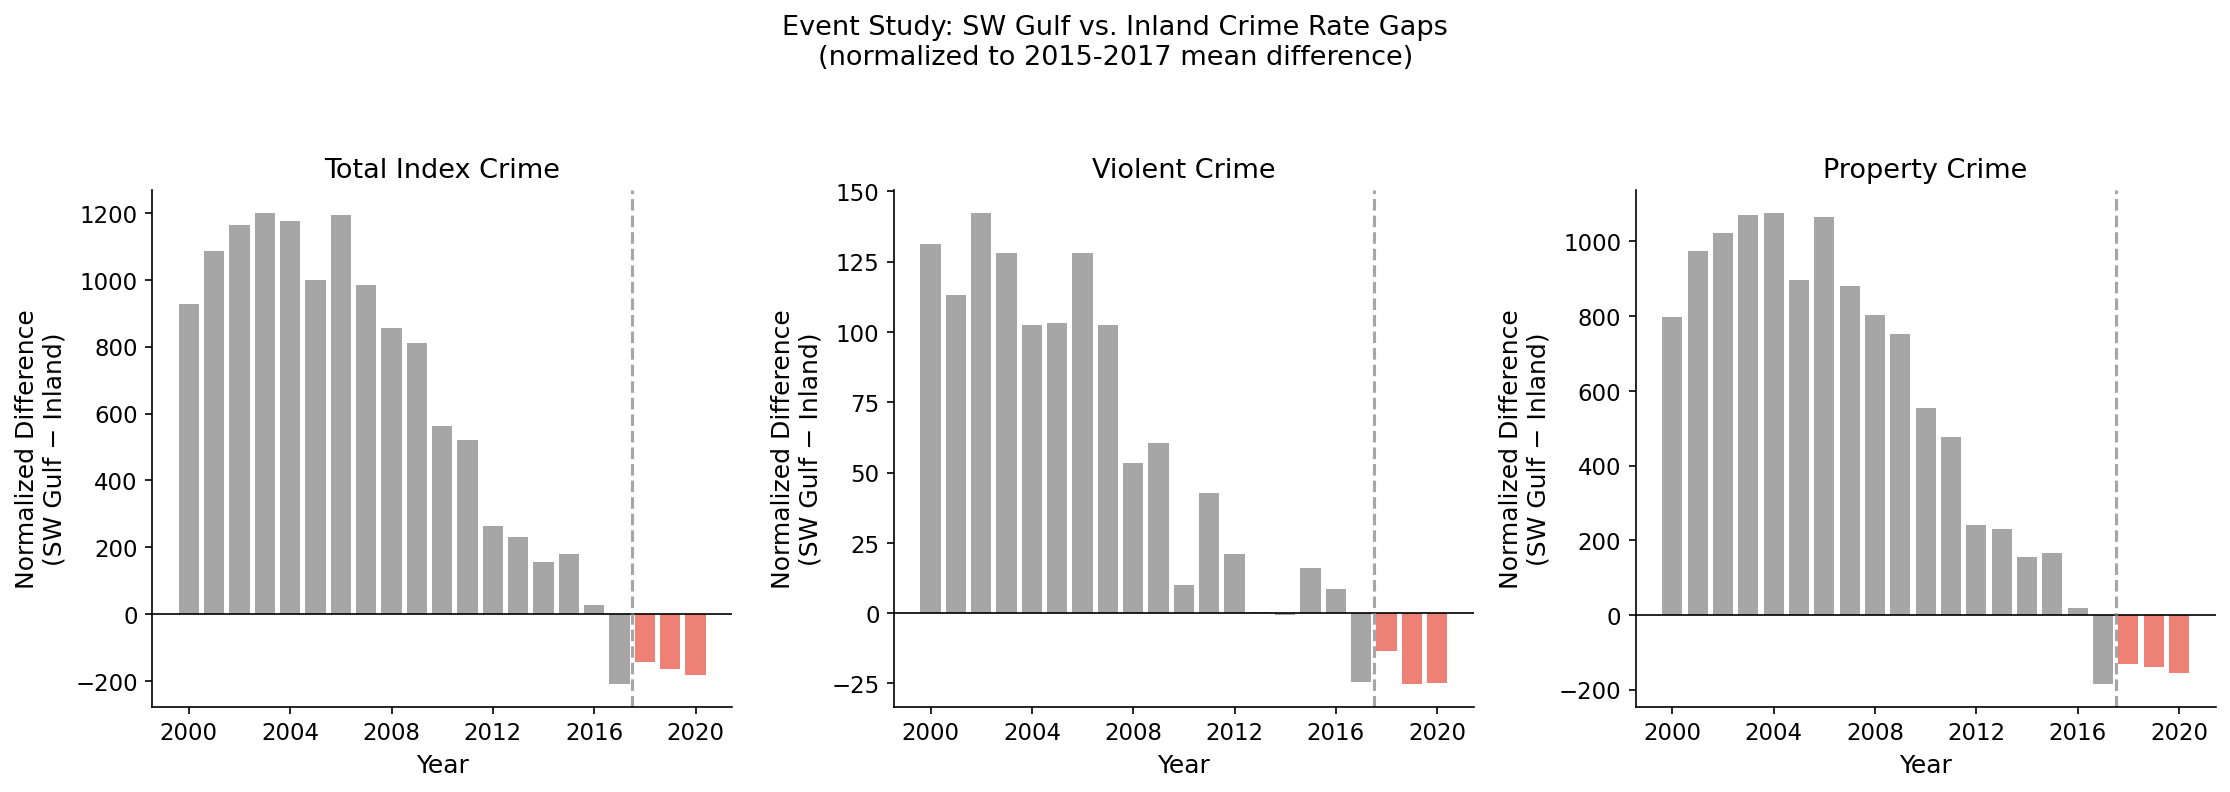 Year-by-year coefficients show that Southwest Gulf counties had been converging toward inland crime rates for nearly two decades. The post-2018 drop is the tail end of that trend, not a break caused by the bloom.
The year-by-year coefficients showed that Southwest Gulf counties had substantially higher crime rates than inland counties throughout the 2000s, and that gap had been closing steadily for almost twenty years. The post-2018 numbers weren't a sharp break. They were just the continuation of a trend that started long before anyone was talking about the mega-bloom.
The placebo test confirmed it. We ran the same analysis using Atlantic Coast counties — coastal, but not exposed to the 2018 red tide — as a fake treatment group. Atlantic counties showed a post-2018 crime decline of nearly identical magnitude (−409 per 100,000, p = 0.005). Since they weren't affected by K. brevis, the pattern clearly reflects broader coastal-vs-inland dynamics, not a bloom effect.
Tourism: Not the Mechanism You'd Expect
When we interacted the 2018 effect with tourism dependence, something unexpected showed up. The post-2018 crime decline was concentrated entirely in low-tourism Gulf counties. High-tourism counties — the ones you'd expect to be most disrupted by a red tide economic shock — showed essentially no change.
Neither theory predicts this. Strain theory says the most tourism-dependent places should see the biggest crime increase (most economic damage). Routine activities says they should see the biggest decrease (most victims removed). What we're seeing instead is just differential rates of the broader coastal-inland convergence, driven by forces much larger than any single bloom.
The First-Stage Null
One more result worth mentioning. General Strain Theory's causal chain runs bloom → economic disruption → strain → crime. We tested the very first link: do blooms increase county unemployment? They don't — not in the full panel, not among Gulf Coast counties, not even in the most tourism-dependent places.
That doesn't mean red tides are economically harmless. The $184 million in losses from 2018 was real. But those losses are concentrated in specific industries, transient, and apparently well-buffered by the broader county economy. They don't show up in the unemployment rate. And without that economic strain, the theoretical pathway from bloom to crime has no mechanism to work through.
Why This Matters
Null results don't always get much attention, but this one is informative. The disaster-crime literature has mostly studied hurricanes and floods — events that hit suddenly, destroy infrastructure, displace people, and overwhelm law enforcement. HABs are different in ways that matter:
They're slow. Hurricanes concentrate damage into hours. Red tides build over weeks and last months, which gives communities time to adapt — redirect marketing, organize cleanup work, shift public safety resources.
They don't destroy anything physical. Hurricanes flatten buildings, creating conditions for looting and social disorganization. Red tides leave homes, businesses, and police stations fully intact.
Their economic impact is narrow. Even in Monroe County, Florida's most tourism-dependent, tourism is about 40% of employment. In most bloom-affected counties it's below 20%. A major hurricane can disrupt the entire county economy at once. Red tide hits one sector hard and leaves the rest largely alone.
For coastal communities, the practical takeaway is reassuring. Red tides are devastating ecologically and economically. But a crime surge is not one of the consequences, and public safety agencies don't need to plan for one on top of everything else.
The Bigger Picture: AQUAVIEW and Interdisciplinary Data
This study is also a proof of concept for a kind of research that's only recently become practical. We took 209,000 biological water samples, spatially joined them to county boundaries, and merged them with satellite chlorophyll-a, sea surface temperature, crime records, labor statistics, and climate data. Finding the right datasets was almost as hard as analyzing them.
Without AQUAVIEW vs. With It
To build the environmental side of this study the traditional way, you'd need to:
- Navigate to NOAA NCEI's ArcGIS REST API (at the non-obvious
gis.ncdc.noaa.gov) to find HABSOS cell counts, figure out the pagination, and pull 209,000 records - Visit CoastWatch ERDDAP and search through hundreds of satellite products for the right chlorophyll-a dataset — VIIRS or MODIS? Daily or monthly? Science quality or near-real-time?
- Go to a different ERDDAP server (the UAF/ERD node) for MUR SST, and choose among dozens of SST products
- Visit NDBC and manually figure out which of their thousands of buoy stations are near the Florida Gulf Coast, then download each one separately
- Repeat for SECOORA, CO-OPS tide gauges, and every other monitoring network you might need
Each source has its own website, API, data format, and metadata conventions. A criminologist who's never worked with ocean data could spend weeks just figuring out where to look.
With AQUAVIEW, a search for "chlorophyll" filtered to CoastWatch returns the VIIRS monthly product immediately, with variable names, temporal coverage, spatial resolution, and download links. "MUR SST" surfaces the right product from 268,000 options. A spatial query for Florida across the NDBC collection returns all 156 relevant buoy stations at once. Standardized metadata, consistent format, same interface.
The real point isn't that it's faster (though it is). It's that AQUAVIEW makes datasets findable that you might not have known existed. "What environmental data covers Florida's Gulf Coast?" is a question that spans 37 data sources. AQUAVIEW makes it one search. For researchers coming from outside the ocean sciences, that's often the difference between a study getting off the ground and not.
What's Next
The same approach works for questions we haven't gotten to yet:
- Oil spills and crime. AQUAVIEW catalogs NOAA's Incident News database — thousands of geolocated oil and chemical spill records. The Deepwater Horizon disaster affected hundreds of Gulf communities over months. The data to test this are sitting there.
- Sea surface temperature and violence. The MUR SST product we used as a control could become the main exposure variable, extending the heat-crime literature into the coastal zone.
- Coastal erosion and property crime. NOAA shoreline change data could test whether communities losing land to the sea see changes in property crime or insurance fraud.
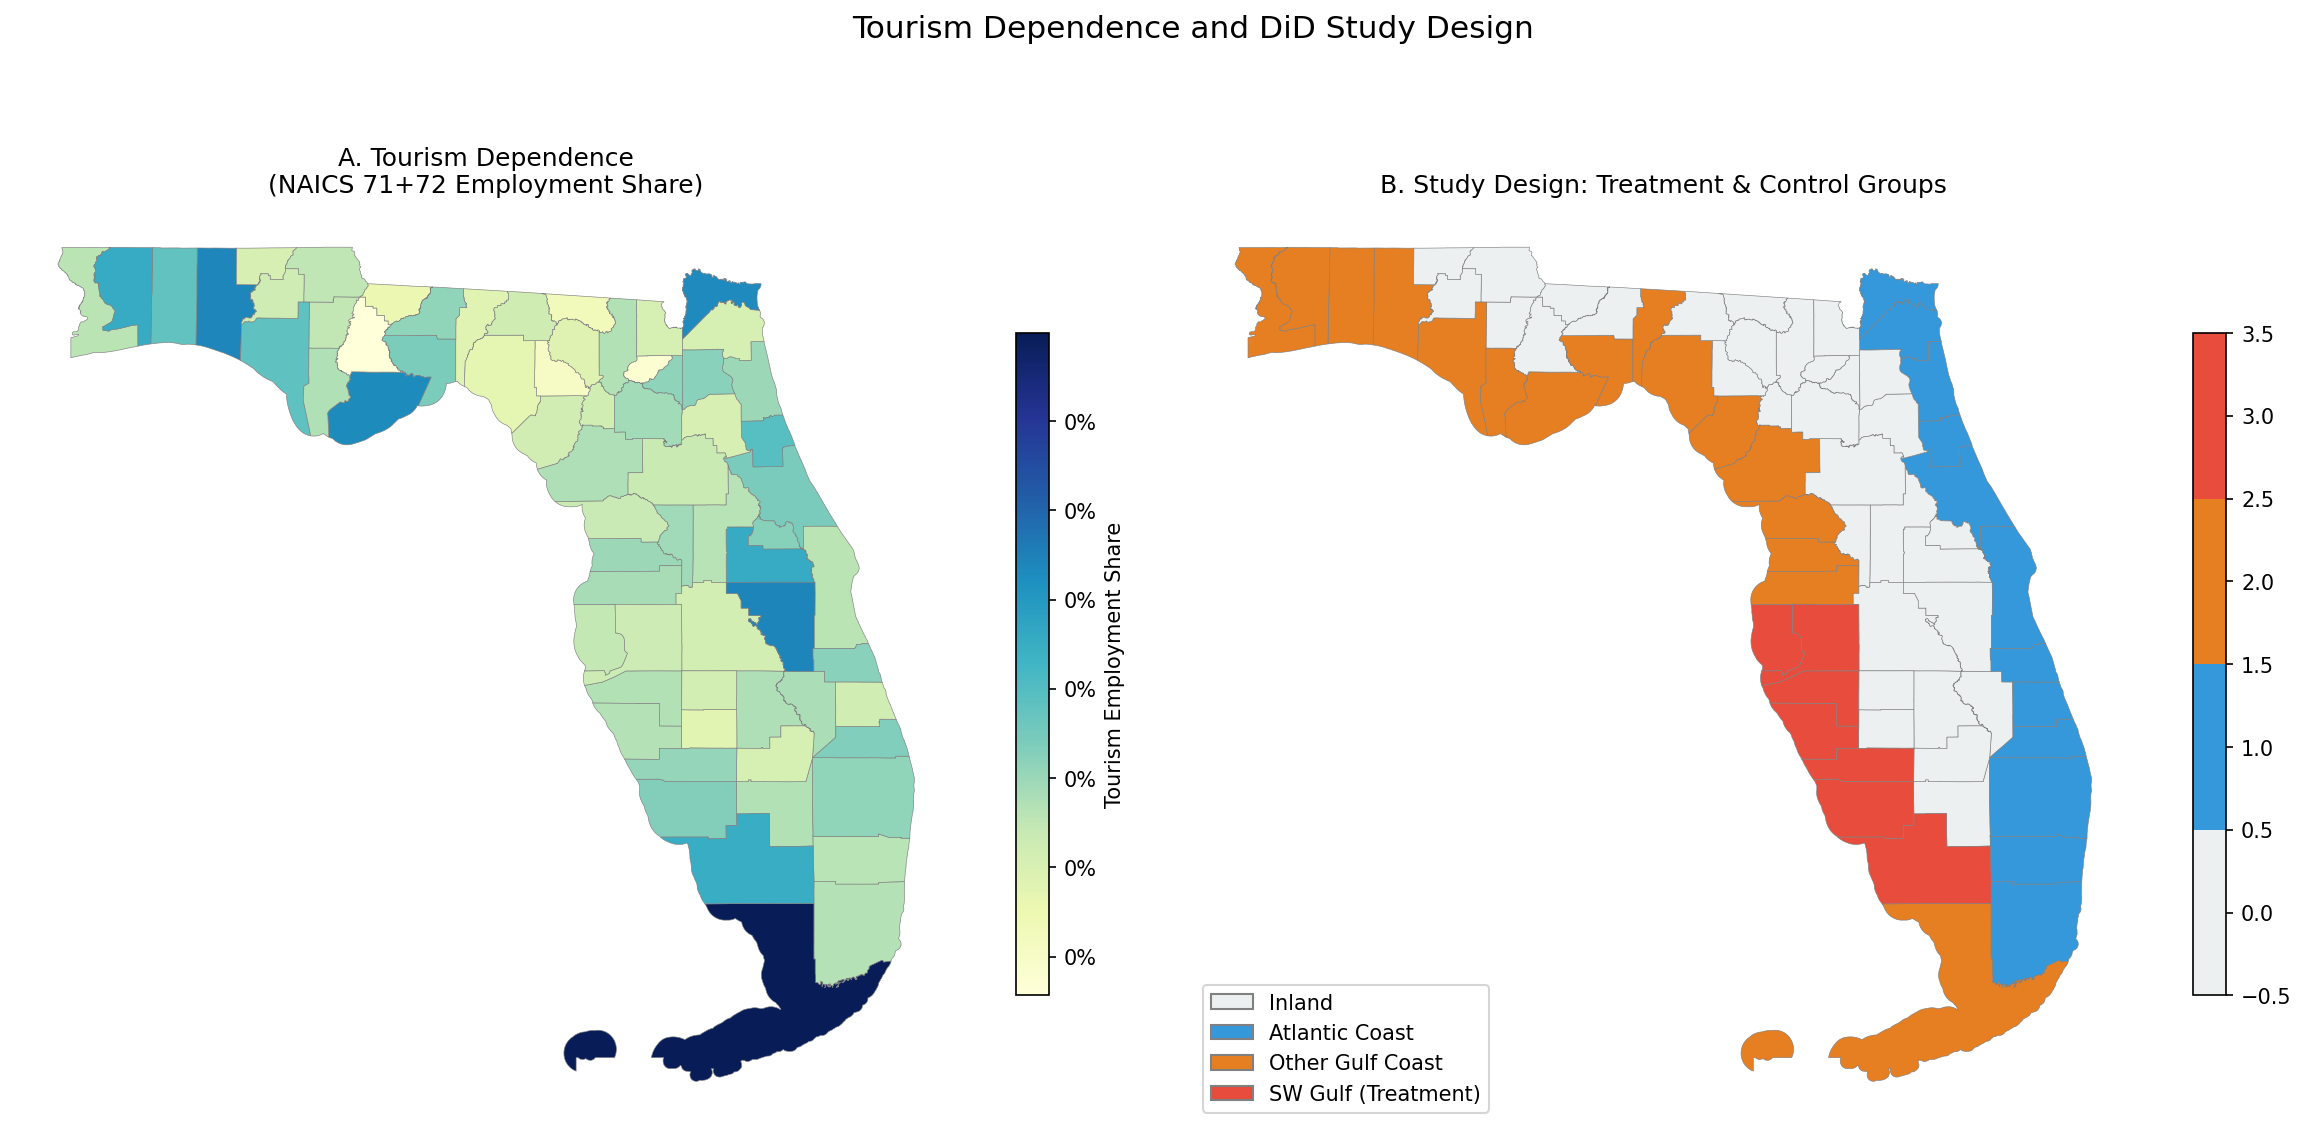 Florida counties classified by coastal status and tourism dependence.
For Coastal Communities
If you live on the Gulf Coast, you already know what red tide does. You've smelled it, coughed through it, watched the fish pile up. You've seen the closed beaches and empty parking lots.
But twenty-one years of data, across every county in Florida, say the same thing: red tide doesn't make your neighborhood less safe. Whatever strain it puts on the local economy, communities absorb it. The social fabric holds.
For researchers, the takeaway is that environmental monitoring and social science have more to say to each other than either field has realized. The data are there. The tools are ready.
Joshua B. Hill is a professor at the University of Southern Mississippi and director of the Institute for Advanced Analytics and Society (IAAS). This research is part of the Ocean Exploration Cooperative Institute (OECI), supported by NOAA.
Interested in using AQUAVIEW for your own research? Visit the AQUAVIEW platform or contact the team at IAAS.
Share this article
New posts by email
Stay up to date with AQUAVIEW. No spam, ever.